Execution and Result Analysis
Running Automated Tests
After implementing the test script using Probato, the next step is to execute automated tests to validate the application’s functionalities. The execution can be efficiently performed by following the steps below:
-
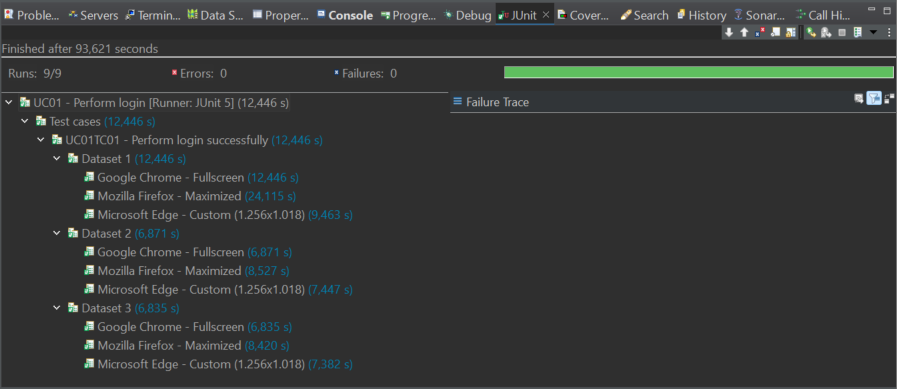
Execution via IDE:
- Use the IDE to start test execution with JUnit.
- If necessary, adjust the configuration files (
configuration.yml) to customize the execution, such as wait times, browser used, or target environment (development, staging, production).
-
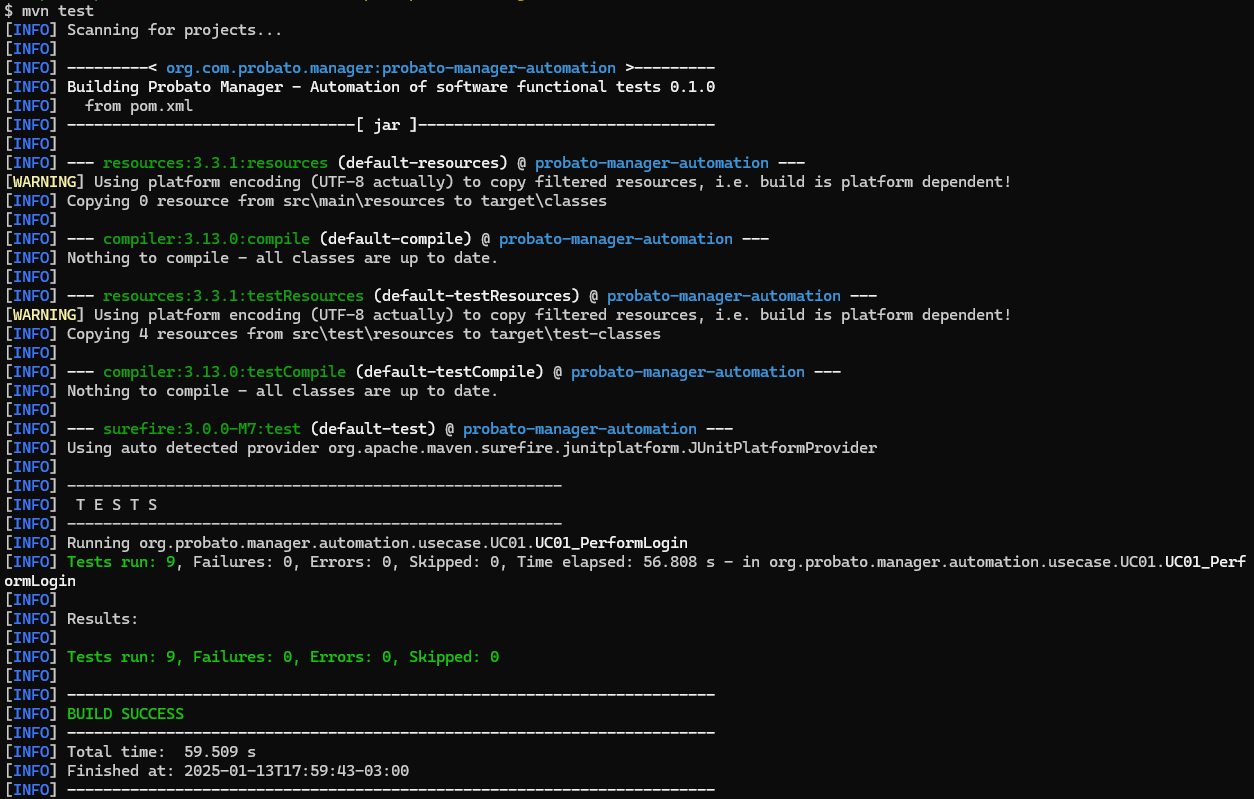
Execution via Terminal:
- Use commands like
mvn test(Maven) orgradle test(Gradle) to start the test execution. - Monitor the logs generated during execution to identify errors or unexpected behaviors.
- Use commands like
-
Execution in CI/CD Pipelines:
- Integrate tests into continuous integration pipelines, such as Jenkins, GitHub Actions, or GitLab CI, to ensure automated validation with every code change.
- Configure notifications to alert the team about test failures.
Note
The execution process is similar to that used in the terminal.
Warning
The execution environment must have all necessary resources installed.
Result Collection
During test execution, Probato collects relevant data for analysis, such as:
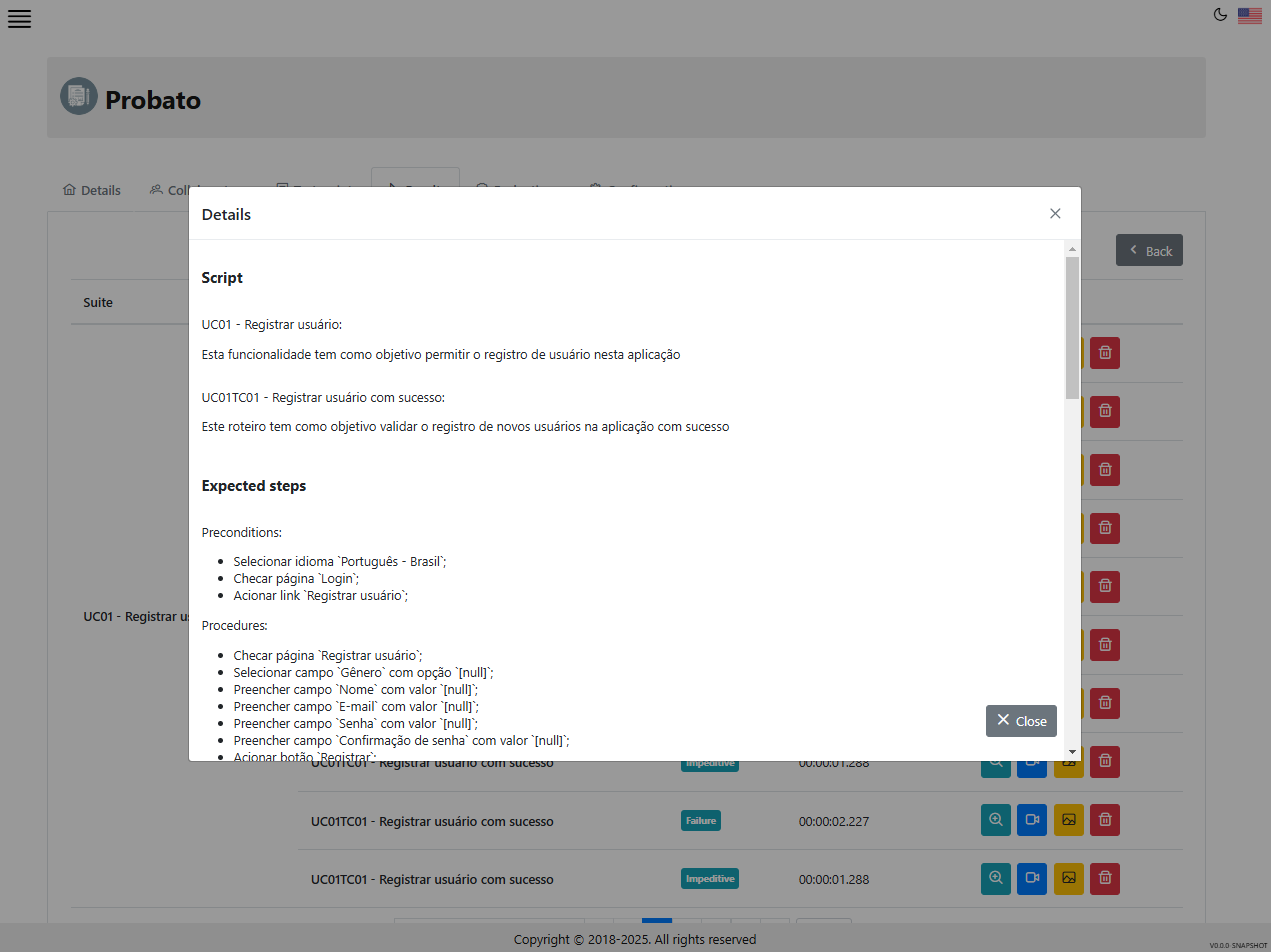
- Executed steps:
Each action performed by the script is logged, providing a detailed history of the execution. - Screenshots and videos:
In case of failure, screenshots and videos of the execution moment are automatically generated to facilitate analysis. - Validation results:
Information about which tests passed or failed, with details on the errors encountered. - Execution time:
Reports indicate the total time for each test, helping to identify performance bottlenecks. -
SQL Logs:
All SQL commands executed during the test are logged, enabling auditing of database changes.Note
This data is temporarily stored on disk during test execution. Once each script is completed, the data will be submitted to the Probato Manager.
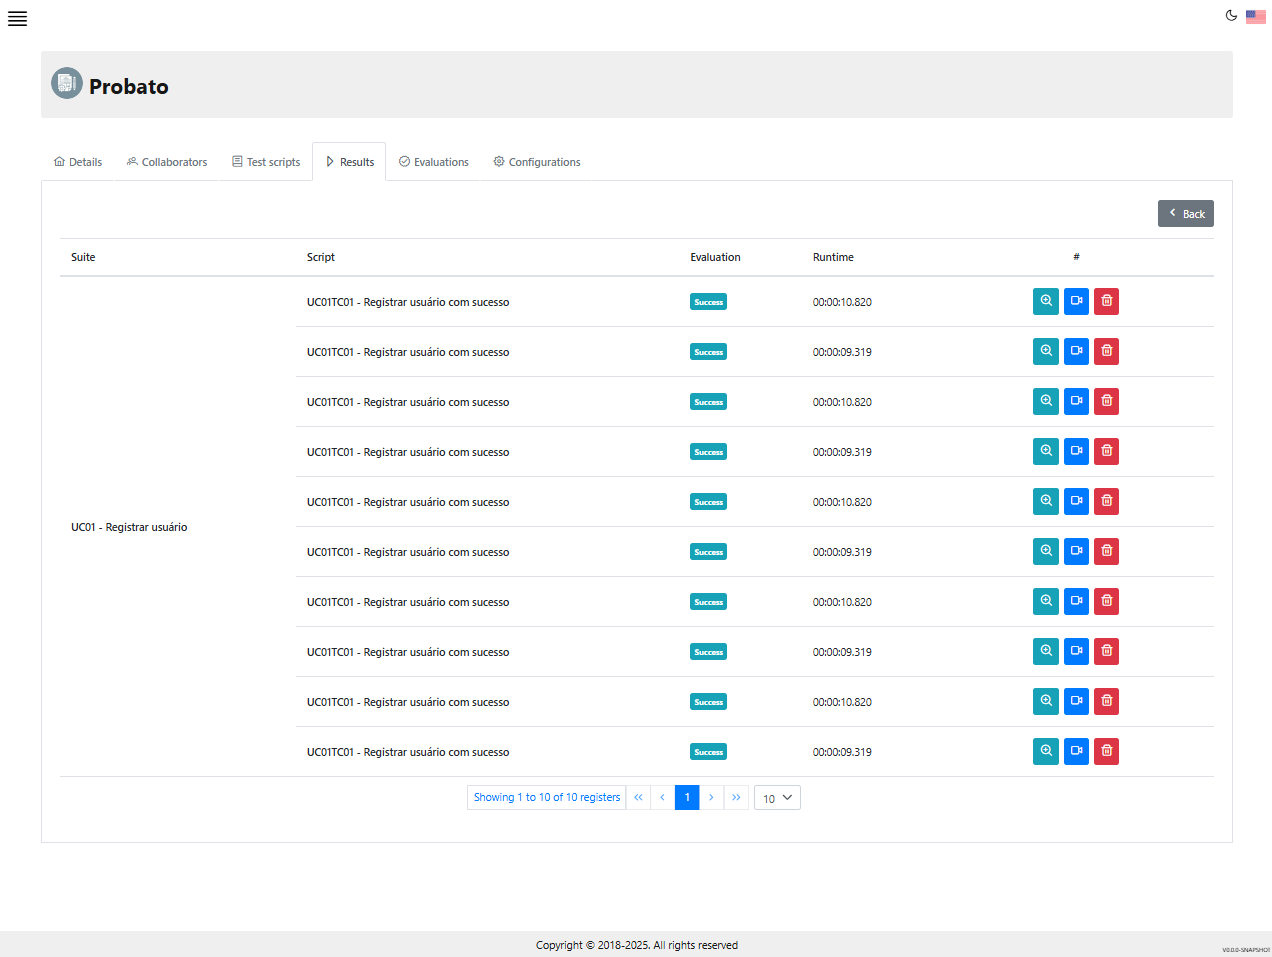
Result Analysis
After execution, a detailed analysis is essential to identify failures and improve system quality. Probato provides a dedicated application for this purpose: Probato Manager. Through this tool, the data collected during test execution is stored, observed, and analyzed. Quality metrics derived from the collected data are also available in this tool.
-
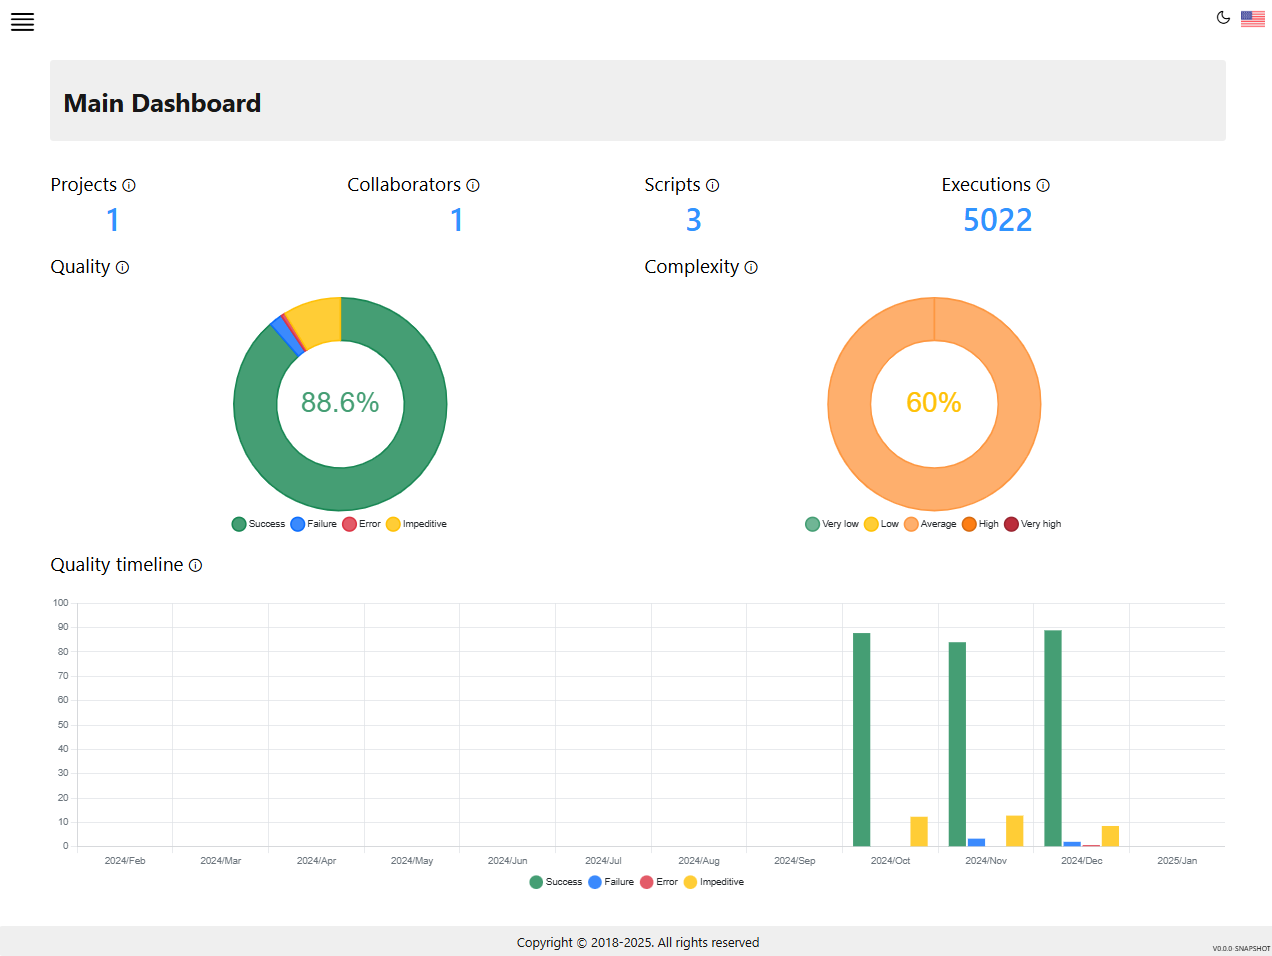
Quality Metrics:
- The Probato Manager graphically provides quality metrics of the target applications over their evolution. These same metrics can also be viewed for a specific application.
- The Probato Manager offers various metrics, such as the number of analyzed projects, collaborators, suites, scripts, executions, average product complexity, and quality history over time.
-
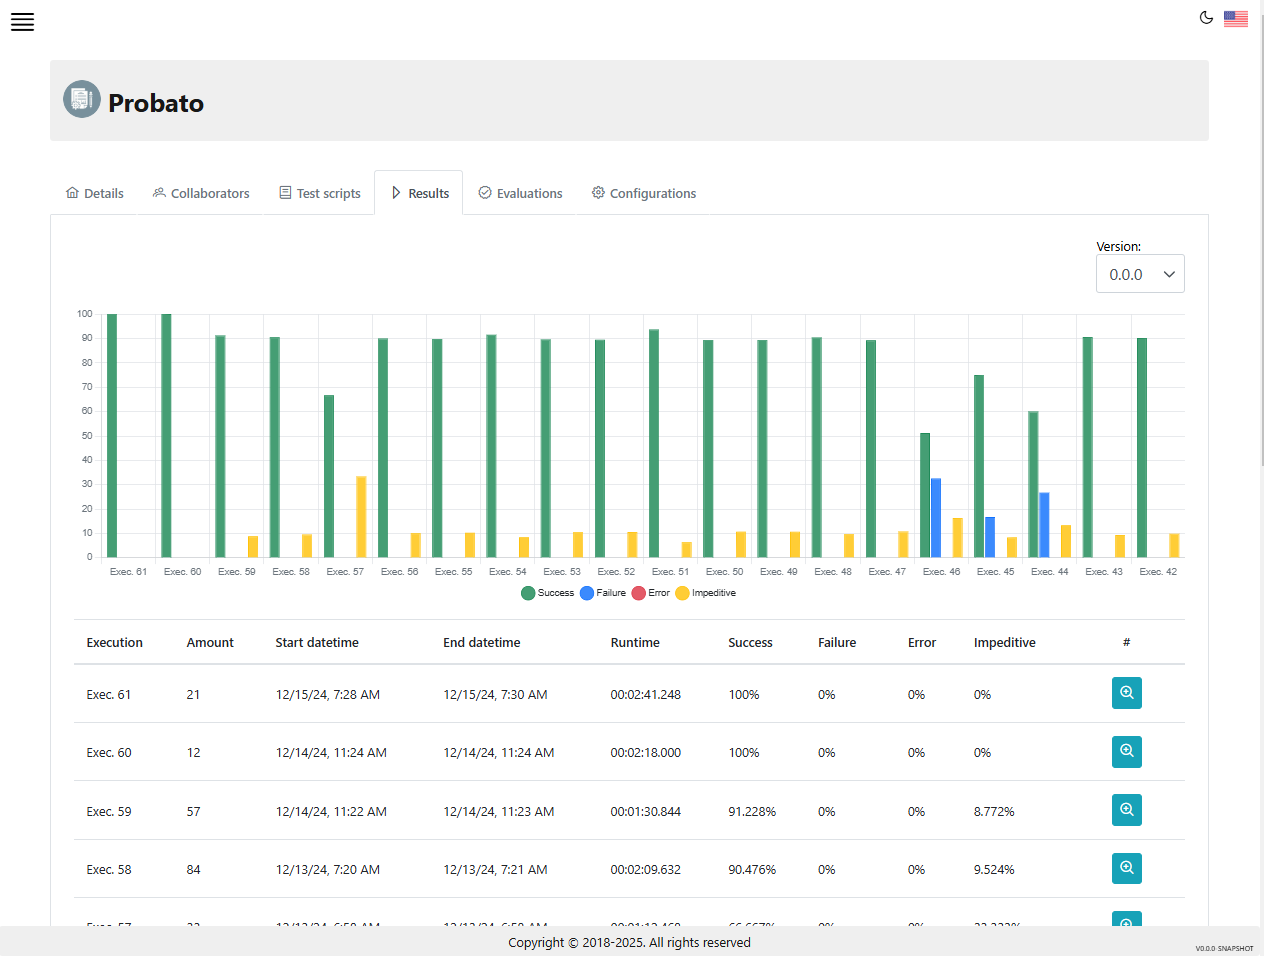
Detailed Reports:
- Use the reports generated by Probato Manager to view the status of each test, errors found, and collected evidence.
- Check the correlation between reported errors and application logs to identify the root cause.
-
Requirement Validation:
- Ensure that all scenarios defined in the requirements were validated.
- Update test cases as new requirements or application changes arise.
-
Tracking Failures:
- For each identified failure, create tickets in project management tools such as Jira, Trello, or GitLab.
- Prioritize fixing the most critical failures to ensure errors are resolved before proceeding with new implementations.
Final Checklist
Before concluding the result analysis in Probato Manager, ensure that:
- ✅ All relevant logs were analyzed and correlated with the reported errors.
- ✅ All failed test cases were documented in project management tools.
- ✅ Reports were generated and sent to stakeholders.
- ✅ The execution environment was reviewed to ensure consistency in future executions.
🎉 Ready to further enhance your system’s quality!